
In this article:
- Overview
- Getting Started
- How to Create an AI Widget in a Report
- Adding a Widget to a Report Page
- Editing an AI Widget
- Viewing the Data and Code Behind a Widget
- What Updates AI Widgets
- AI Widget Limitations
- Usage
- Security and Privacy
- Getting Help
Overview
Reach Reporting has integrated with Claude, Anthropic's AI assistant, so you can build metrics called AI Widgets directly inside your reports. Instead of manually configuring rows, columns, and data ranges in the metric builder, you describe what you want to see in plain language, and Reach AI generates the widget for you.
Note: AI Widgets are currently in beta. This article covers AI Widgets in reports. For dashboards, see Reach AI Widgets. Support for consolidations is on the roadmap.
To create an AI Widget, type a prompt in natural language. For example, you might type: "Show net income vs. operating cash flow for the last five quarters as a grouped bar chart." Reach AI builds the widget from your connected company data, and you can place it on any report page alongside your statements, text, live text, and standard metrics.
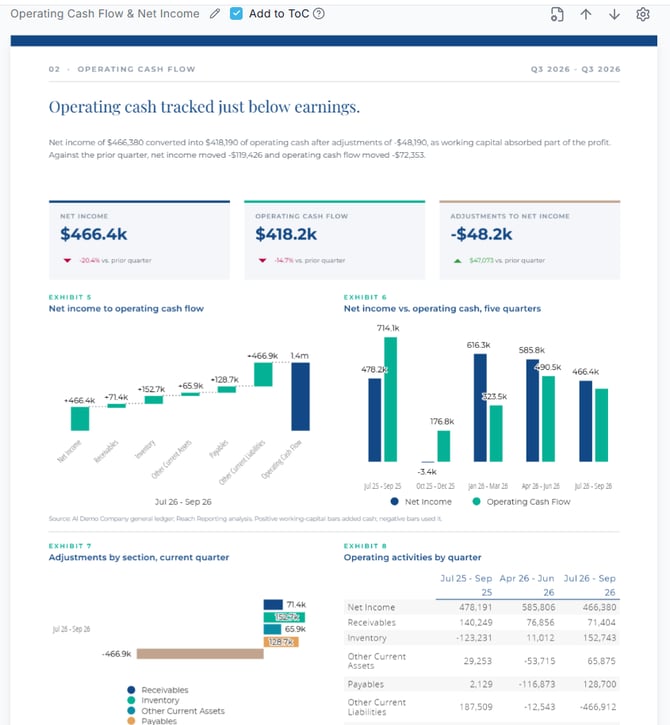
AI Widgets cut the time spent configuring metrics. They're especially useful if you're still learning the metric builder or want a custom, presentation-ready visual for a client report without building it by hand.
You do not need a Claude account to use this feature. It works directly within Reach Reporting.
Tip: For more on enabling AI features in your workspace, see AI Enhanced Reporting.
Getting Started
Before you can use AI Widgets, AI must be enabled at both the workspace and company levels.
Step 1 — Enable AI at the Workspace Level
The workspace owner must turn on AI reporting in workspace settings. Click the gear icon in the upper right corner of the workspace and check the box for "AI Enhanced Reporting."

Step 2 — Enable AI for Individual Companies
Next, go to Company Settings > AI Enhanced Reporting and turn on the AI feature for the company. You need to do this for each company where you want to use AI Widgets.


For full instructions, see Enabling AI Enhanced Reporting.
How to Create an AI Widget in a Report
Step 1: Open an existing Report or create a new one for the company you want to work in. See Reports: Getting Started if you're new to the report builder.
Step 2: In the left toolbar, select Metric. In the Metrics panel, click Create New, then choose AI Widget.
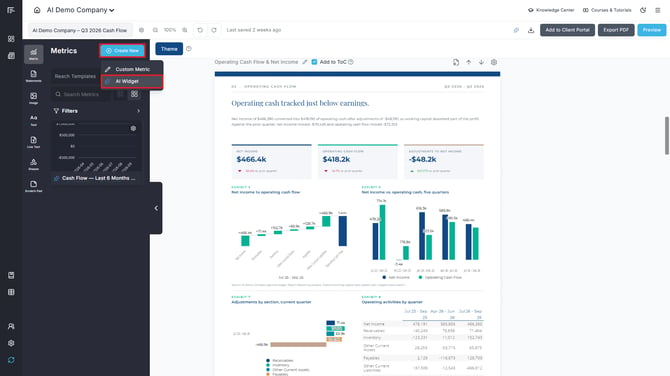
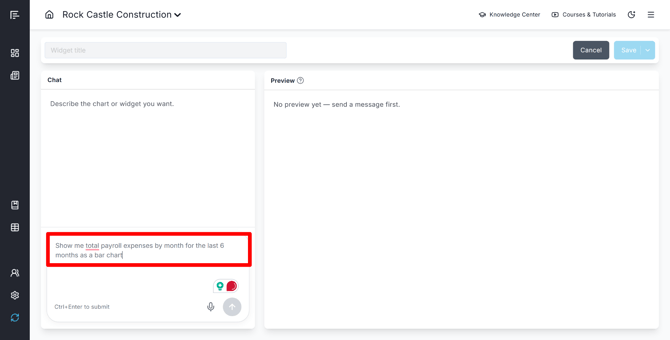
Step 3: Type a prompt describing the widget you want. Include the data you want to see, the time period, and the chart type if you have a preference. The more specific your prompt, the more accurately Reach AI can build it. For example, "Show net income to operating cash flow for the current quarter as a waterfall chart" returns a more targeted result than "show cash flow."
Tip: Reports are often printed or shared as a PDF, so it helps to mention how the widget should look on the page. For example, you could ask for "a compact table with quarters as columns" or "brand colors with a legend below the chart."
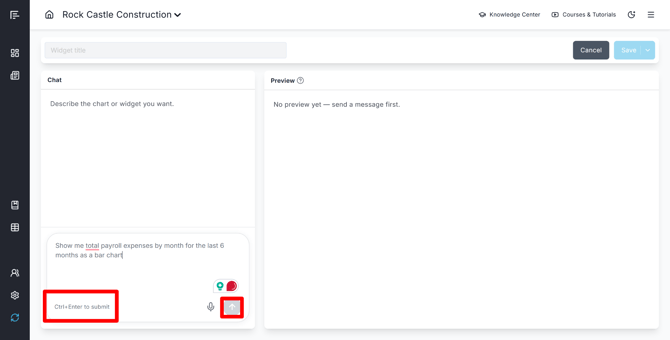
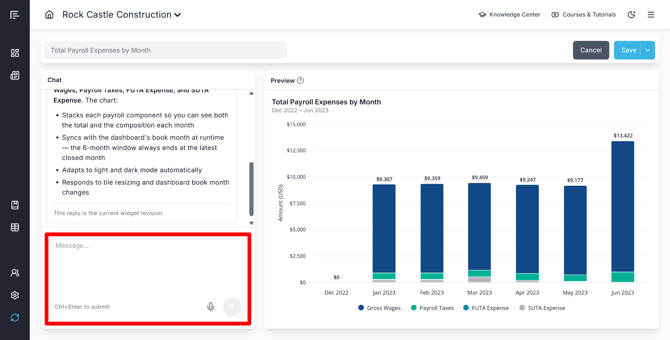
Step 4: Submit the prompt by clicking the Send button or pressing Ctrl + Enter. Reach AI generates the widget from your connected company data. This can take a few minutes, depending on how complex the request is.
Step 5: When the widget is ready, review it. To make changes, enter another prompt.
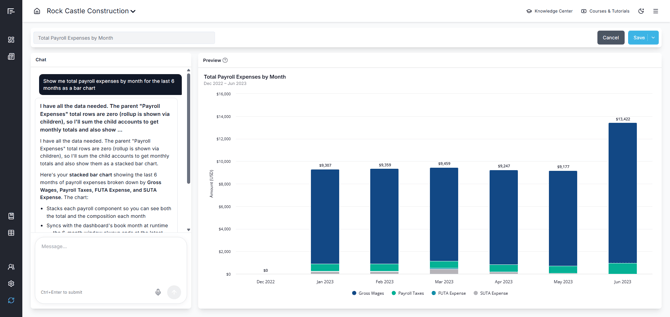
Step 6: Click Save and Close. Your new widget appears on the page.
Editing an AI Widget
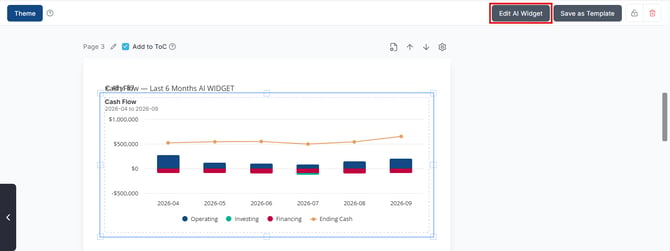
To edit a widget, click the widget directly from the report page. Select the widget on the page, then click Edit AI Widget in the toolbar at the top right.
Previewing and Reverting a Widget
AI Widgets support version history. After you submit another prompt, you can:
- Preview a previous version of the widget
- Revert to an earlier version if a new prompt produced an unwanted result
This lets you try different prompts and refine your widget without losing earlier work.

Resizing a Widget
On the report page, select the widget and drag its corner handles to resize it. The widget adjusts to fit the new size.
Removing a Widget
To take a widget off a report page, select it on the page and delete it.
Saving a Widget as a Template
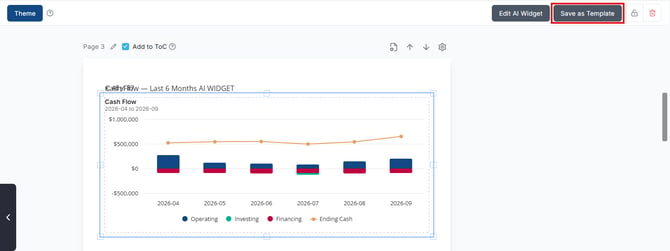
To reuse a widget in other reports, select the widget on the report page, then click Save as Template in the toolbar at the top right.
Viewing the Data and Code Behind a Widget
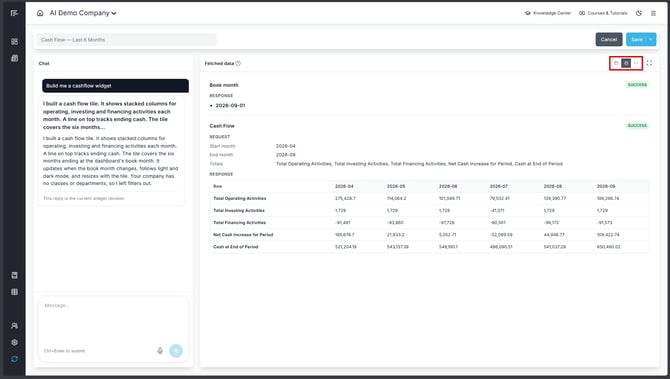
While building or editing an AI Widget, you can see exactly what data Reach AI pulled and how the widget is built. Use the buttons in the upper right corner of the widget panel to switch between the widget preview, the fetched data, and the code.
Step 1 — View the Underlying Data
Click the Fetched data button (the middle icon) to see the data used in the widget. Each request Reach AI made is listed with its status, the request details (such as the start month, end month, and totals pulled), and the response returned from your company data. This is a quick way to confirm the widget uses the numbers you expect before the report goes to a client.
Step 2 — Edit or Copy the Raw HTML
Click the Code button (the <> icon) to open the raw HTML behind the widget. From here you can:
- Edit the HTML directly, then click Commit to apply your changes to the widget.
- Copy the HTML to reuse it elsewhere or share it with your team.
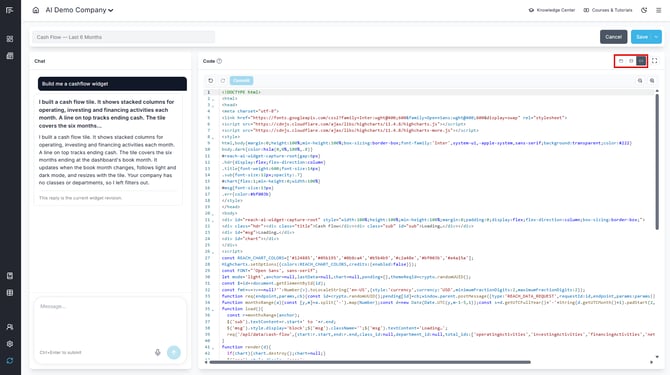
To return to the widget, click the Preview button (the first icon).
What Updates AI Widgets
Once an AI Widget has been created, the following keep it current:
- Book Month updates: When the book month advances, the widget's data updates, just like standard metrics. This makes AI Widgets a good fit for recurring monthly or quarterly reports. See Book Month — How to Use for more information.
- Syncing the company: A company sync refreshes the underlying data in your AI Widget. See Syncing Your Company for instructions.
AI Widget Limitations
Because AI Widgets are generated differently from standard metrics, there are a few limitations to be aware of:
- AI Summary: The report's AI summary tool does not work on AI-generated widgets.
- Filter: The report filter does not apply to AI Widgets. You can handle filtering within the widget itself or by revising your prompt.
- Export to Excel: AI Widgets are not included when you use Export to Excel.
Note: Standard metrics, statements, and other objects in the same report are not affected by these limitations and continue to work normally.
These are known beta limitations and may be addressed in future updates.
Usage
- AI Widgets are included with your Reach Reporting subscription. No separate Claude subscription or account is required.
- There is a monthly usage limit for AI Widget generation. This limit applies only to the AI widget feature and is separate from the token usage tracked for other AI features in Reach Reporting. If you need more capacity, contact support through the live chat or at support@reachreporting.com.
- For details on how token usage is tracked for AI-powered reports and dashboards more broadly, see Token Usage and Limits.
Security and Privacy
The AI Widget integration is built with the same data security standards applied across Reach Reporting's AI features:
- Your data is not used to train any AI models. The data sent to generate your widget is used only to fulfill your request.
- Reach Reporting uses a third-party API that is SOC 2 Type 2 certified.
- Data is protected with encryption at rest (AES-256) and in transit (TLS 1.2+).
For full details, visit the Reach Reporting Security page and Privacy Policy.
Getting Help
If you have questions about AI Widgets in reports or run into issues during the beta, our support team is here to help. Click the chat bubble in the lower right corner of the screen, or email us at support@reachreporting.com.
Go to the Reach Reporting app>
ARE YOU NOT CURRENTLY USING REACH REPORTING?
learn more at reachreporting.com
We are dedicated to helping you.
- Need Additional Help?
Your success is important to us.
Whether you're working as a CFO of a business or part of an accounting firm, Reach Reporting is here to improve your working knowledge of reporting and provide service tips and skills to ensure you're at the top of your game.
We make sure that you have access to staff members who are best suited to help you. We work together to resolve issues and create memorable moments that empower you to enhance your reporting skills.
We are here to listen to you. We understand that using new technology can be frustrating, so we can answer questions or jump on a quick Zoom call. Our entire staff has an in-depth knowledge of Reach Reporting and can quickly direct you to best practices to improve your reporting.
We are focused on providing solutions that save you time and increase your value. We continue to improve each day and look forward to visiting with you. Your communication with us is vital and appreciated.
Please feel free to chat with us by clicking the help chat bubble in the lower right-hand corner of this page.
Reach out to your Reach Reporting Rep and schedule a Zoom meeting by clicking the meeting link in their email signature.
Or schedule to join our ongoing webinars.
Reach Reporting is dedicated to helping provide a knowledge base that is easy to understand and informative. If you still have questions that have not been answered, please let us know by emailing support@reachreporting.com, chatting with our support team, or calling us at (877) 467-7637. We are here to ensure that you have a positive experience with Reach Reporting, as we want to continue to be the reporting solution you trust.
Need more access to Reach Reporting Resources?
Reach Reporting has a wealth of knowledge and a robust online community to support you as you create reports that provide powerful insight. Please look into the following resources.
Reach Reporting Blog: We add blogs to our site every month to give you great information in a fun and friendly manner.
Case Studies: We interview one company per month to help our clients highlight how they are using Reach Reporting and how it is improving their services and firm offerings. These case studies are invaluable to our community.
Knowledge Center: From simple to complicated, we provide step-by-step guidance to utilize every aspect of Reach Reporting in our robust knowledge center.
Video Tutorials: We know watching is sometimes easier than reading, which is why all of our tutorials are video-based in the video tutorial section of Reach Reporting and Youtube.
Social Networks: Join us on FaceBook, LinkedIn, Youtube, and Twitter.
Monthly Newsletter: Go to the footer of reachreporting.com and sign up to receive the Reach Reporting newsletters delivered directly to your inbox. Our newsletters cover tips and tricks, current events in accounting, strategies to improve your advisory services, and much more.
We look forward to helping you build insightful reports,
The Reach Reporting Team.