In this article:
- Overview
- Customizing Dashboards
- Adding Components to Dashboards
- Live Text in a Dashboard
- Using Data Sheet Data for Dashboard Live Text
- Interacting With Your Dashboard
- Saving a Dashboard as a Template
Overview
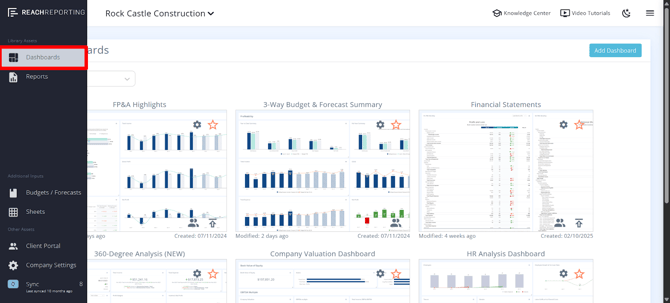
First, to access dashboards in your Workspace, open the company.
When you select the dashboard icon on the left, you can view all of your dashboards.
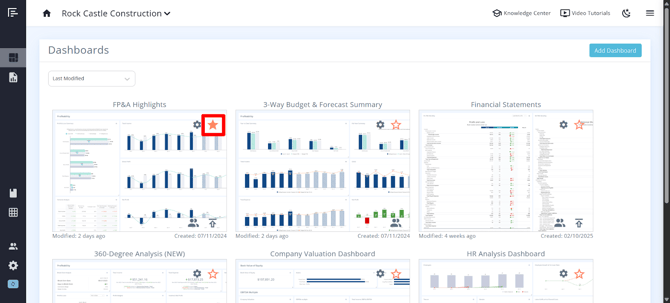
You can select the star to make a dashboard a favorite to give you quick access.
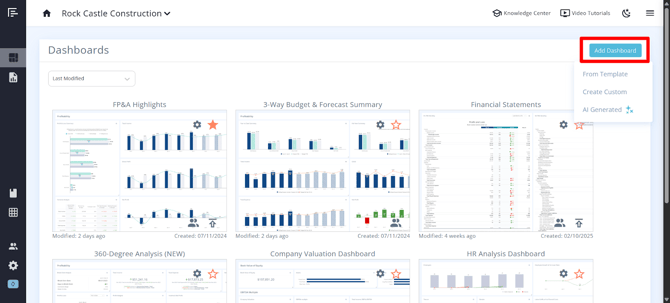
You can add a new dashboard if you have built and saved one as a template. Or you can access some pre-built templates, create a custom dashboard from scratch, or generate a dashboard using our AI tool.
Customizing Dashboards
When you open a dashboard, you can customize the layout by dragging the metrics to where you want them on the screen. Simply click and hold to drag a metric into the desired position. This will automatically rearrange other metrics so you can place the metric where you want it.
To adjust the size of a metric, hover over and then select the drag icon in the lower right corner of the metric.
Adding Components to Dashboards
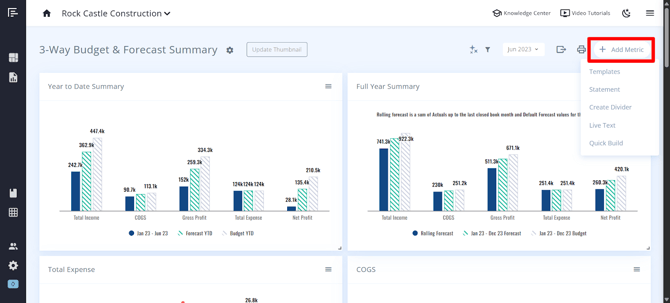
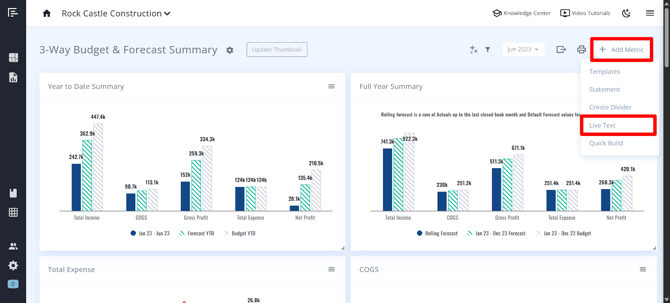
To add a metric, select “Add Metric” and then choose from Templates, Statements, or Quick Build. You can also create Dividers or add Live Text to your dashboard.
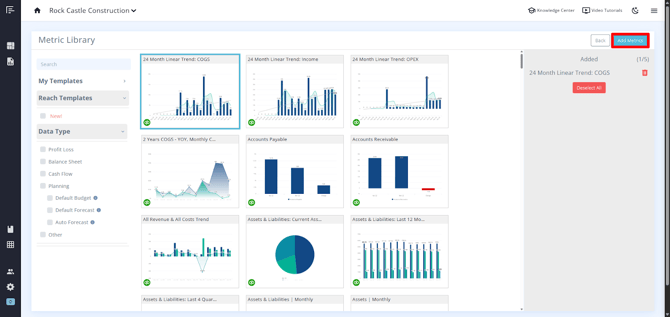
Templates refer to pre-built templates available to all users. “My Templates” are metrics that you have built and then added to your templates.
Metrics can be added to your templates from any report or dashboard.
You can select favorites or choose some metrics based on the chart or table. All of these can be added and then customized. You can add multiple metrics at a time.
Once you select the metrics, select “Add Metrics,” and this will add them to your dashboard.
If you choose to add a metric, and select “Quick Build”, you can build a custom metric with ease. Check out this Knowledge Center article for more on Building Metrics and Statements with Reach Reporting.
Live Text in a Dashboard
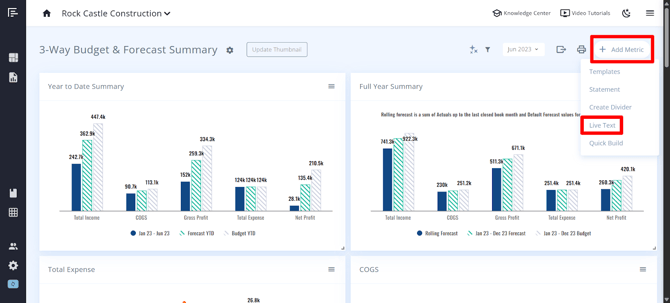
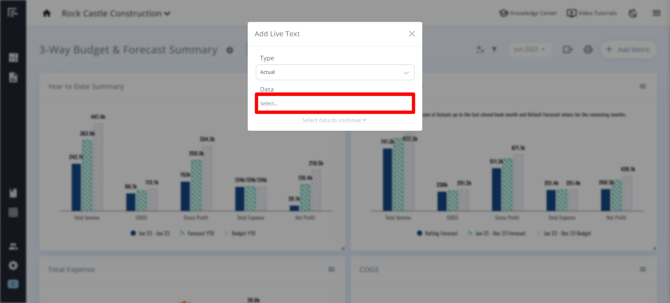
To add Live Text in a dashboard, click Add Metric > Live Text.
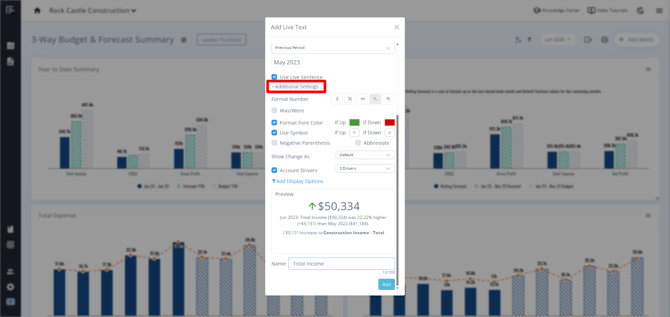
You can add Live Text from your Actuals or Budget/Forecast data, or show comparisons.

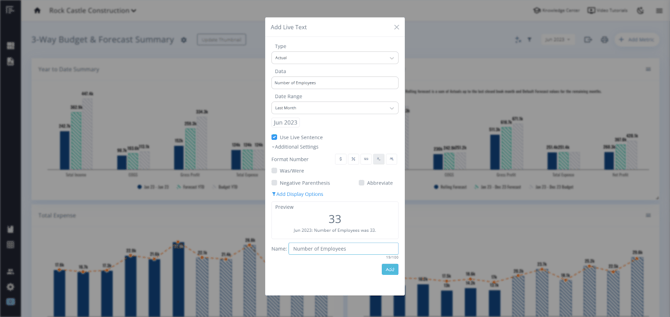
In the additional settings, you can also customize the format of the Live Text or add Display Options. Check out this Knowledge Center article for more on Display Options: Date Drop-down Ability and Display Options: Class/Dept Filter Override.
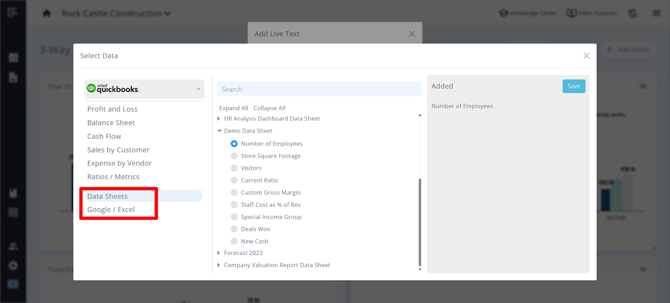
Using Data Sheet Data for Dashboard Live Text
You can use data from your Data Sheets, Google Sheets, or Excel Sheets directly within the live text on your dashboard. This allows you to showcase non-financial or external data seamlessly.
Select Add Metric > Live Text > Data > Select data from Data Sheets, Google, or Excel.
You can then format your custom Live Text as you see fit.
Interacting With Your Dashboard
Sharing a Dashboard
Once you are ready to share a dashboard, you can check out this Knowledge Center article for How to Publish Dashboards.
You can also make interactive features available for your audience in the Client Settings. See our Knowledge Center article on How to Publish Dashboards for more information on how to configure the settings for published dashboards.
AI Insights
Our AI-enhanced reporting feature was designed to revolutionize the way you analyze and interpret your data. This advanced feature allows you to quickly analyze dashboards, providing you with deeper insights and a more comprehensive understanding of your data. Check out this Knowledge Center article for more on how to set up and utilize our AI-enhanced reporting tool.
Dashboard Filters
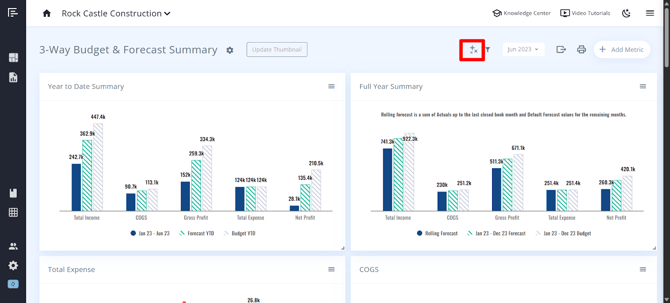
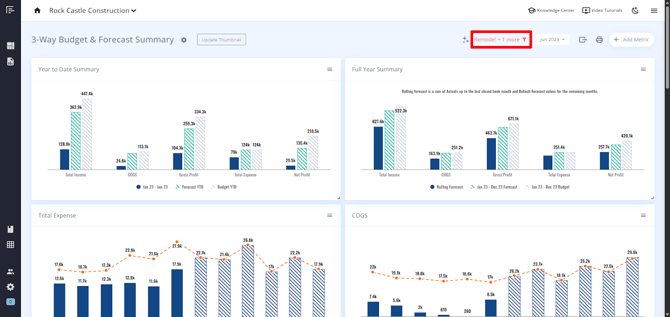
You can apply class, department, or location filters across your entire dashboard with one click.
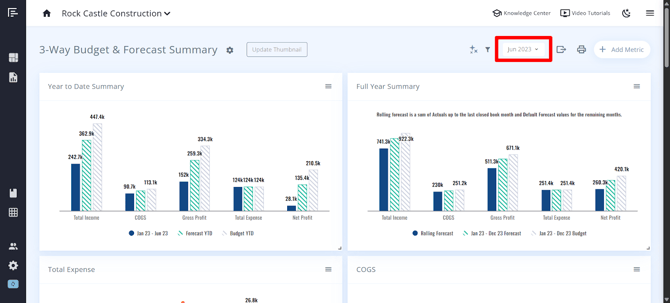
Last Closed Month Dropdown
This option allows you to select which month of data you want to view from a dropdown menu. You can view historical data up to the book month set in the company settings. This feature is particularly useful for reviewing trends over time or comparing performance across different periods.
Export to Excel
You can export your dashboards directly to Excel, complete with all your charts and visualizations. Whether you're sharing insights with your team or digging into the data offline, it's easier than ever to take your reports on the go.
The export includes all visible metrics and data points displayed on the dashboard, allowing clients to perform their own analysis, create custom reports, or integrate the data with other systems.
Note: The Excel export captures the dashboard in its current state, including any applied filters or selected time periods.
Note: The following items from the dashboards will not export to Excel:
- Conditional formatting icons (conditional formatting text colors will export)
- Combo charts (i.e. a line chart with a column chart)
- Chart colors (colors will depend on the theme colors chosen in excel)
Printing Dashboards to PDF
This feature is useful for creating printed reports or archiving dashboard snapshots.
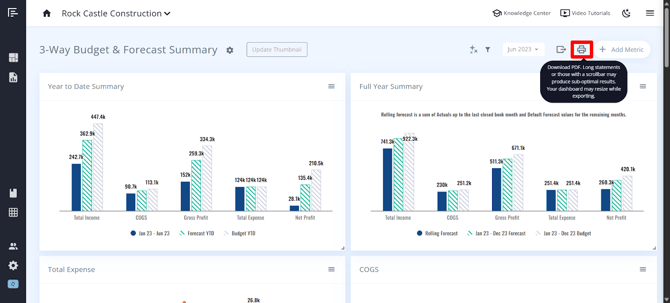
Important considerations when printing to PDF:
- Long statements or dashboards with scrollbars may produce sub-optimal results
- Your dashboard may resize during the export process to fit the PDF format
- For best results, consider the dashboard layout and length when designing dashboards that will be frequently printed
Saving a Dashboard as a Template
After you have created a dashboard you wish to use a template, you can check out this Knowledge Center article for more on Creating Enhanced Financial Reporting Templates.
Go to the Reach Reporting app>
ARE YOU NOT CURRENTLY USING REACH REPORTING?
learn more at reachreporting.com
We are dedicated to helping you.
- Need Additional Help?
Your success is important to us.
Whether you're working as a CFO of a business or part of an accounting firm, Reach Reporting is here to improve your working knowledge of reporting and provide service tips and skills to ensure you're at the top of your game.
We make sure that you have access to staff members who are best suited to help you. We work together to resolve issues and create memorable moments that empower you to enhance your reporting skills.
We are here to listen to you. We understand that using new technology can be frustrating, so we can answer questions or jump on a quick Zoom call. Our entire staff has an in-depth knowledge of Reach Reporting and can quickly direct you to best practices to improve your reporting.
We are focused on providing solutions that save you time and increase your value. We continue to improve each day and look forward to visiting with you. Your communication with us is vital and appreciated.
Please feel free to chat with us by clicking the help chat bubble in the lower right-hand corner of this page.
Reach out to your Reach Reporting Rep and schedule a Zoom meeting by clicking the meeting link in their email signature.
Or schedule to join our ongoing webinars.
Reach Reporting is dedicated to helping provide a knowledge base that is easy to understand and informative. If you still have questions that have not been answered, please let us know by emailing support@reachreporting.com, chatting with our support team, or calling us at (877) 467-7637. We are here to ensure that you have a positive experience with Reach Reporting, as we want to continue to be the reporting solution you trust.
Need more access to Reach Reporting Resources?
Reach Reporting has a wealth of knowledge and a robust online community to support you as you create reports that provide powerful insight. Please look into the following resources.
Reach Reporting Blog: We add blogs to our site every month to give you great information in a fun and friendly manner.
Case Studies: We interview one company per month to help our clients highlight how they are using Reach Reporting and how it is improving their services and firm offerings. These case studies are invaluable to our community.
Knowledge Center: From simple to complicated, we provide step-by-step guidance to utilize every aspect of Reach Reporting in our robust knowledge center.
Video Tutorials: We know watching is sometimes easier than reading, which is why all of our tutorials are video-based in the video tutorial section of Reach Reporting and Youtube.
Social Networks: Join us on FaceBook, LinkedIn, Youtube, and Twitter.
Monthly Newsletter: Go to the footer of reachreporting.com and sign up to receive the Reach Reporting newsletters delivered directly to your inbox. Our newsletters cover tips and tricks, current events in accounting, strategies to improve your advisory services, and much more.
We look forward to helping you build insightful reports,
The Reach Reporting Team.