In this article:
- Past Data Drivers
- Target-Based Driver
- Other Row Drivers
- Forecast Features: Automatic Updates
- Refreshing Row Drivers
- Best Practices
What Are Row Drivers?
Row drivers are powerful automation tools in Reach Reporting's Budgets Pro that allow you to reference historical data and apply various calculation methods to project future values. Instead of manually entering values for each account and period, row drivers intelligently calculate budget amounts based on past performance, growth trends, and business targets.
Each row in your budget starts with the default custom data entry driver, which you can modify at any level—one row at a time, multiple rows simultaneously, or even an entire financial statement at once. This flexibility allows you to tailor your budgeting approach to match how different areas of your business operate.
You can hover over the icons next to each row to see which row driver is being applied:
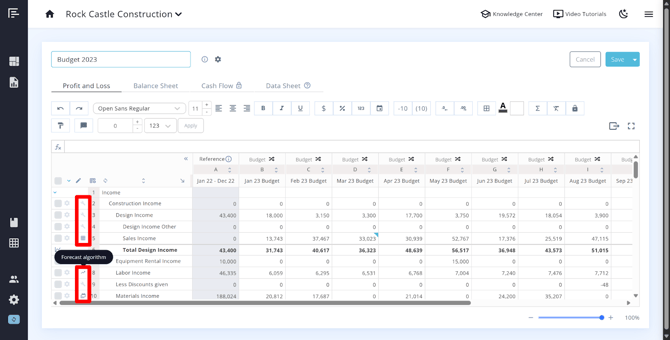
You can click on the row settings gear icon next to each row to see the row driver options:
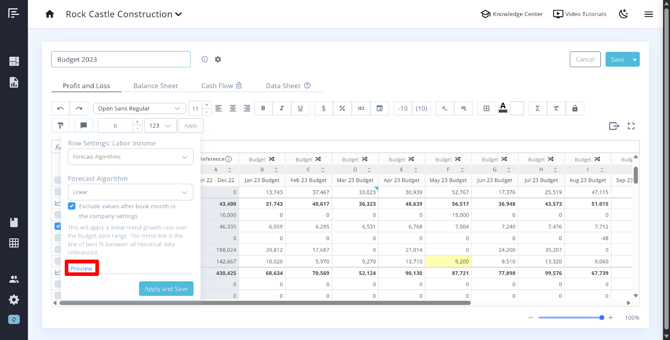
After clicking into the row settings, you can preview how your budget/forecast amounts compare to prior year data:
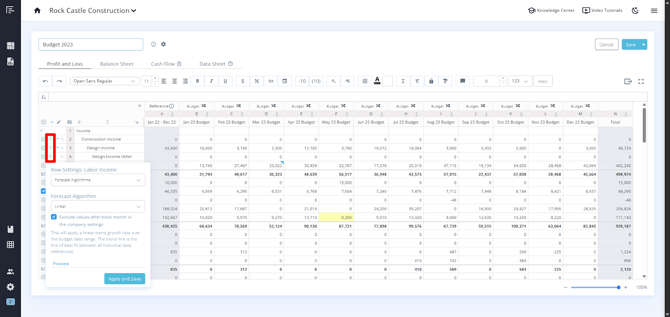
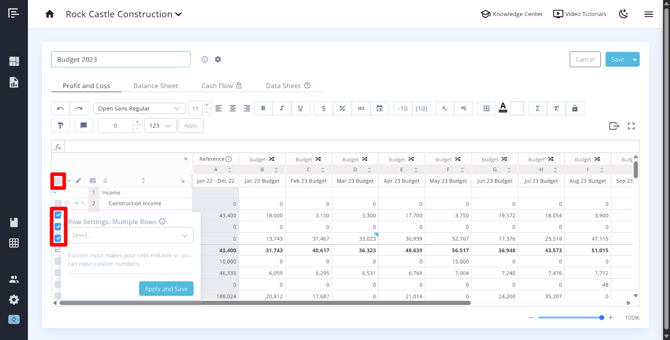
You can use the check boxes next to each row to set row drivers for multiple rows at a time, or you can click the check box in the top left corner to set a row driver for the entire statement:
For a comprehensive overview of budgeting in Reach Reporting, see our guide on Mastering Budgeting with Reach Reporting's 3-Way Planning Tool.
Setting Reference Data
Before using row drivers that reference historical data, you'll need to configure which data the system should look at. Check out our Knowledge Center article on Budgeting with Reference Data for more information on how to set the reference data settings.
Past Data Drivers
Past data drivers perform calculations based on your historical financial data, allowing sophisticated forecasting without complex formulas.
Based on Previous Year
This driver pulls values directly from the prior year and allows you to apply percentage adjustments.
You can choose how to distribute these values:
- Equal Amounts – Applies the same value to each budgeted month
- Seasonality – Preserves the monthly distribution pattern from the prior year
- Best for: Accounts where last year's performance is a good baseline with minor adjustments needed
- Example: Office rent with a known percentage increase for the coming year
Trailing Average
The Trailing Average driver uses rolling averages from a specified number of past months and allows you to apply an adjustment percentage.
You have two options for distributing the trailing average:
- Equal Amounts – Applies the calculated average equally across all budgeted months
- Seasonality – Applies the average while preserving the monthly seasonality pattern from the prior year
- Best for: Smoothing out irregular monthly variations while maintaining seasonal patterns
- Example: Marketing expenses that fluctuate month-to-month but follow a general seasonal trend
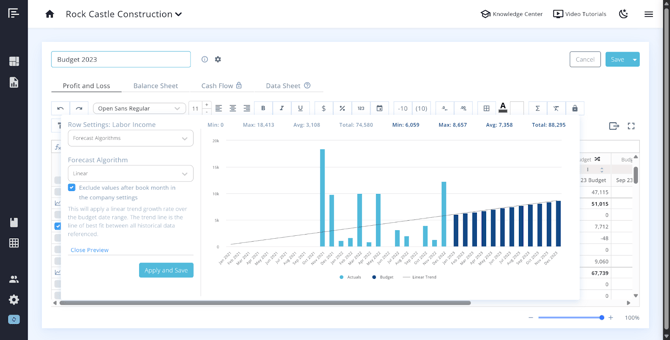
Forecast Algorithm: Linear Trend
The Linear Trend driver creates a line of best fit from the past 24 months of data and projects that trend forward at the same slope. This method works well for accounts with consistent, predictable growth patterns.
- How it works: Analyzes the relationship between time and account values over the past two years, then extends that pattern into future periods
- Best for: Revenue streams or expense categories with steady, long-term growth trends
- Example: A SaaS company with consistent monthly recurring revenue growth
Forecast Algorithm: Period Over Period Growth Rate
This driver calculates the year-over-year growth rate for each month and applies it to your projections. Unlike Linear Trend, this method accounts for monthly seasonality variations.
- How it works: Compares data from two years ago to one year ago, calculates the growth rate for each month, and applies those rates going forward
- Best for: Accounts with seasonal patterns or cyclical business models
- Example: A retail business with higher sales during holiday seasons
Target-Based Driver
Annual Target
The Annual Target driver is perfect for goal-based budgeting. It works differently depending on whether you're budgeting revenue or expenses:
- For Revenue Accounts: Distributes your annual goal across the remaining months in the budget period
- For Expense Accounts: Shows how much budget remains after accounting for spending to date
Distribution options:
Allocation Type
- Seasonality – Applies prior year monthly seasonality patterns to distribute the annual target
- Equal Amounts – Divides the target equally across all budgeted months
Monthly Amounts
- Responsive Monthly Amounts – Adjusts future months dynamically when you manually override specific cells
- Fixed Monthly Amounts – Keeps monthly amounts constant even when you override specific cells
- Best for: Organizations with specific annual goals that need to be tracked throughout the year
- Example: A sales team with a $1.2M annual revenue target distributed seasonally
Troubleshooting Annual Target with Seasonality:
If your Annual Target with Seasonality option is not calculating correctly, check for negative values in the prior year data. Click into the row settings > preview to quickly check for negative values in the prior year. The seasonality calculation cannot process negative growth rates and will return zero instead.
Solution: If you find negative values in the prior year, manually add a negative value to the corresponding cell in your budget. The value should equal the difference between your annual target and the total shown for the budget. This manual adjustment will allow the seasonality calculation to work properly.
Other Row Drivers
Custom
The Custom driver unlocks cells for manual data entry, allowing you to input specific numbers or create formulas for unique calculations.
- Best for: One-time expenses, new revenue streams, or any account requiring manual input
- Example: A planned capital expenditure or launch costs for a new product line
Link to Data Sheet
This driver connects calculations from your Budget/Forecast Data Sheet directly to your Profit & Loss or Balance Sheet.
- Best for: Complex calculations, external data sources, or scenarios requiring custom modeling
- Example: Headcount planning linked to salary calculations in a data sheet
Carry Forward (Balance Sheet Only)
Available only for Balance Sheet accounts, this driver automatically carries the value from the previous month forward. You can override individual cells to adjust the carried-forward values as needed.
- Best for: Balance Sheet accounts that remain relatively stable month-to-month
- Example: Long-term debt balances or accumulated depreciation
Forecast Features: Automatic Updates
One of the most powerful aspects of row drivers is their ability to update automatically as actual data comes in each month within a Forecast. When you set your Forecast Month forward, forecast algorithms and other drivers that reference "actuals to date" will automatically incorporate the new information, keeping your projections current without manual intervention.
Refreshing Row Drivers
When reference data has been updated, changes don't flow automatically. Check out our Knowledge Center article on Budgeting with Reference Data for more information on how to refresh the row drivers.
Best Practices
Match Drivers to Account Behavior
Choose row drivers that reflect how each account actually behaves in your business. Revenue with steady growth benefits from Linear Trend, while seasonal accounts work better with Period Over Period or Seasonality options.
Use Annual Targets for Goal-Setting
When you have specific business objectives, Annual Target drivers help you track progress and ensure your monthly projections align with overall goals.
Review Reference Data Settings
Before finalizing your budget, confirm that your Advanced Settings reference the correct historical periods. Incorrect reference data will produce inaccurate projections.
Combine Drivers with Manual Overrides
Don't be afraid to use automated drivers for most accounts while manually overriding specific months where you have better information. Reach Reporting allows this flexibility.
Test Different Scenarios
Duplicate your budget and try different driver combinations to see which approach produces the most realistic projections for your business.
Go to the Reach Reporting app>
ARE YOU NOT CURRENTLY USING REACH REPORTING?
learn more at reachreporting.com
We are dedicated to helping you.
- Need Additional Help?
Your success is important to us.
Whether you're working as a CFO of a business or part of an accounting firm, Reach Reporting is here to improve your working knowledge of reporting and provide service tips and skills to ensure you're at the top of your game.
We make sure that you have access to staff members who are best suited to help you. We work together to resolve issues and create memorable moments that empower you to enhance your reporting skills.
We are here to listen to you. We understand that using new technology can be frustrating, so we can answer questions or jump on a quick Zoom call. Our entire staff has an in-depth knowledge of Reach Reporting and can quickly direct you to best practices to improve your reporting.
We are focused on providing solutions that save you time and increase your value. We continue to improve each day and look forward to visiting with you. Your communication with us is vital and appreciated.
Please feel free to chat with us by clicking the help chat bubble in the lower right-hand corner of this page.
Reach out to your Reach Reporting Rep and schedule a Zoom meeting by clicking the meeting link in their email signature.
Or schedule to join our ongoing webinars.
Reach Reporting is dedicated to helping provide a knowledge base that is easy to understand and informative. If you still have questions that have not been answered, please let us know by emailing support@reachreporting.com, chatting with our support team, or calling us at (877) 467-7637. We are here to ensure that you have a positive experience with Reach Reporting, as we want to continue to be the reporting solution you trust.
Need more access to Reach Reporting Resources?
Reach Reporting has a wealth of knowledge and a robust online community to support you as you create reports that provide powerful insight. Please look into the following resources.
Reach Reporting Blog: We add blogs to our site every month to give you great information in a fun and friendly manner.
Case Studies: We interview one company per month to help our clients highlight how they are using Reach Reporting and how it is improving their services and firm offerings. These case studies are invaluable to our community.
Knowledge Center: From simple to complicated, we provide step-by-step guidance to utilize every aspect of Reach Reporting in our robust knowledge center.
Video Tutorials: We know watching is sometimes easier than reading, which is why all of our tutorials are video-based in the video tutorial section of Reach Reporting and Youtube.
Social Networks: Join us on FaceBook, LinkedIn, Youtube, and Twitter.
Monthly Newsletter: Go to the footer of reachreporting.com and sign up to receive the Reach Reporting newsletters delivered directly to your inbox. Our newsletters cover tips and tricks, current events in accounting, strategies to improve your advisory services, and much more.
We look forward to helping you build insightful reports,
The Reach Reporting Team.