How to is metrics in the Reach Reporting Builder.
In this article, we are going to focus on adding metrics to your reports.
First, open metrics by clicking the metric icon at the top, and this section will expand. Within this section, there is a drop-down that allows you to add templates from pre-built metrics. In this drop-down, you can choose from the various chart types (line, bar, column, pie, etc.), and if you have already created a metric and added it to your templates, you can access that metric here in “my templates.”
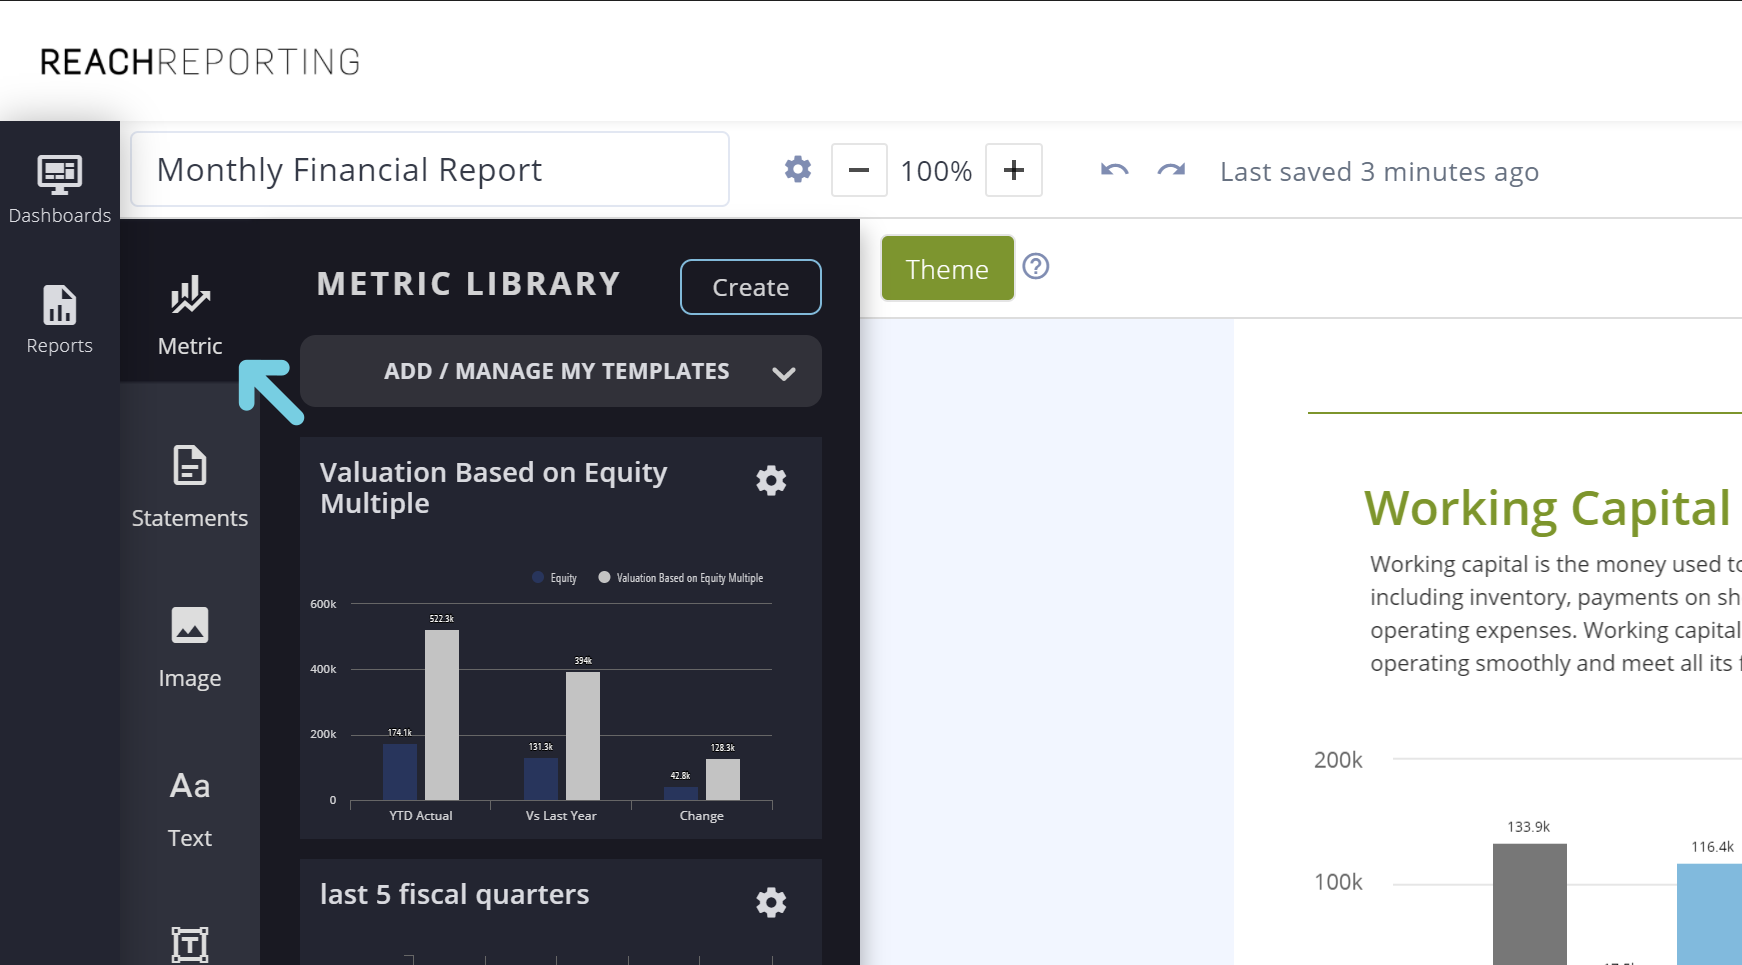
Once you have found the metric you want to add, click and hold while dragging the metric onto the report. Once you release your mouse, the metric will be placed on the page. You can create a new metric by selecting, Create.
Second, now that your metric is on the page, you can resize and move the metric to where you want it. Each page is its own, and you can’t drag content onto a different page.
The metric will auto-format when you resize it so that you can determine how big or small you want to display it.
You will notice when you select a metric, the top menu will change. Here is where you can add the metric as a template to be used on other reports and dashboards within the current company or used on a different company to which you have access.
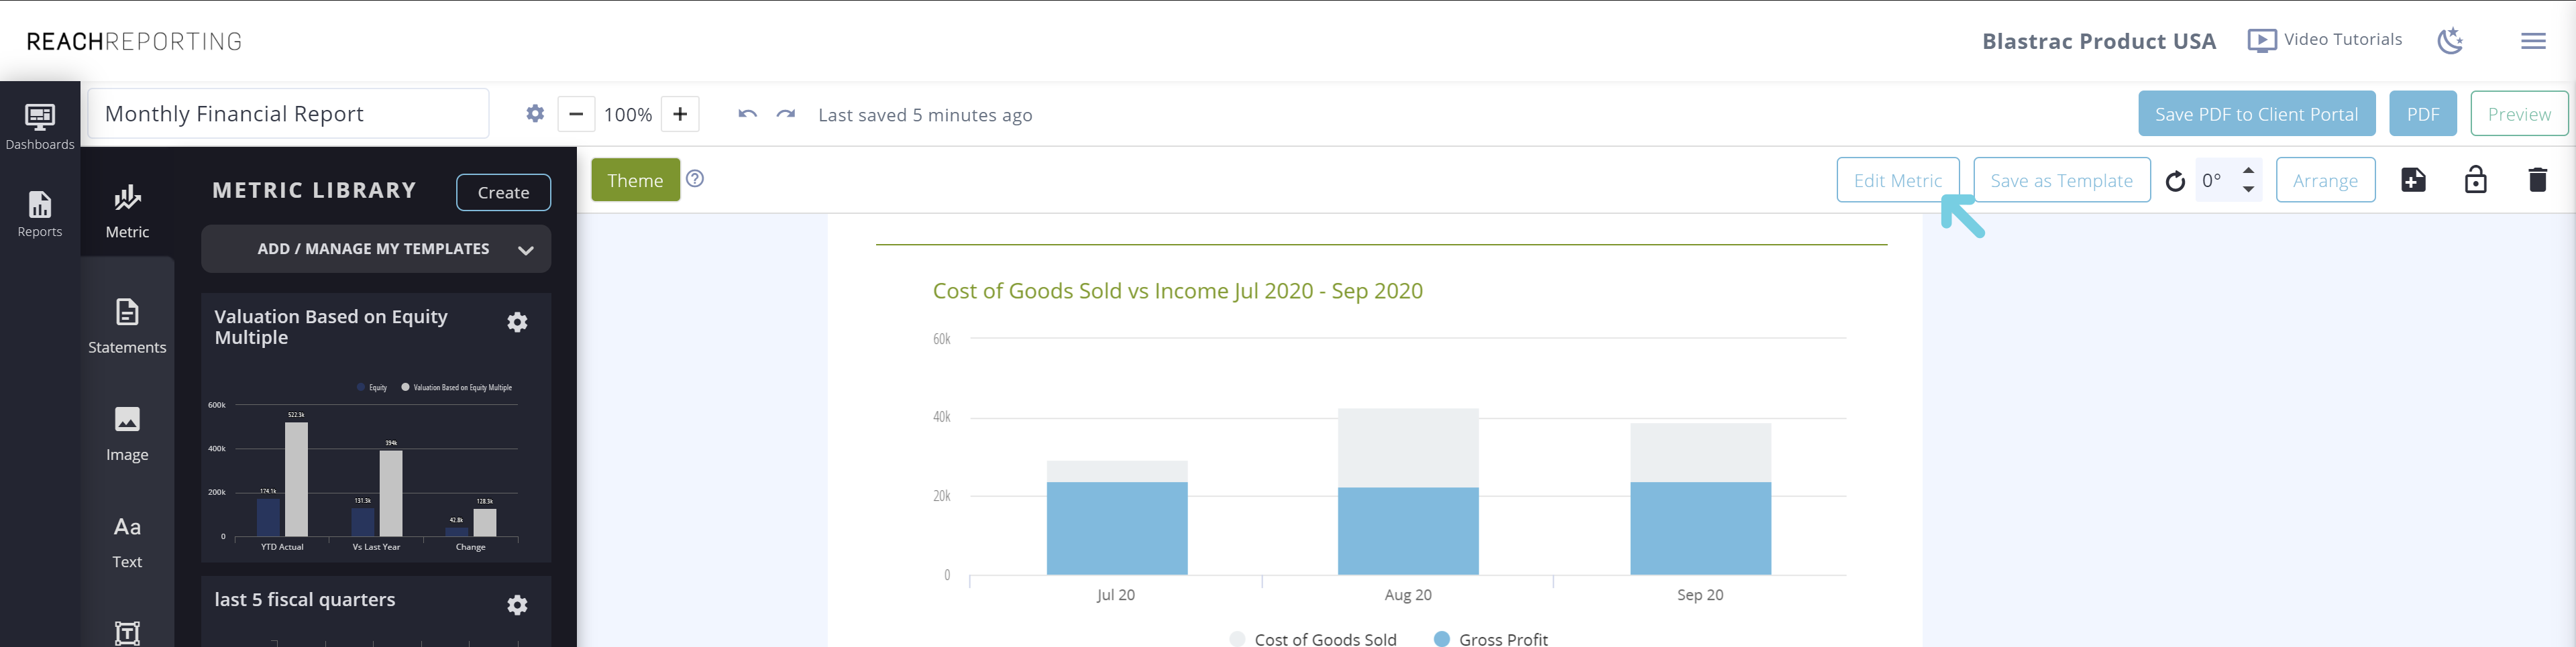
Third, there are several ways to edit and save your metric.
You can click the "Edit Metric" icon in the top right corner, and it will take you to the metric builder. Within the builder, you can;
*Add or change date ranges
*Select or include more data
*Change the metric type
*Adjust colors
*Many other customization options
When you click the "arrange" icon (right of edit metric), you have the ability to;
*Control the angle
*The position (i.e. top, bottom, middle...)
*Manage the layers of multiple objects on the page
*Alignment to the page
Next is the scratchpad icon (next to the arrange icon), where you can add metrics or content to your scratchpad that can be used on other reports.
Lastly, The trash can is for deleting the content that is selected. You can also delete metrics or other content by using the delete or backspace key on your keyboard.
Watch the video below for more information, and if you have any questions, please let us know.
Go to the Reach Reporting app>
ARE YOU NOT CURRENTLY USING REACH REPORTING?
learn more at reachreporting.com
We are dedicated to helping you.
- Need Additional Help?
Your success is important to us.
Whether you're working as a CFO of a business or part of an accounting firm, Reach Reporting is here to improve your working knowledge of reporting and provide service tips and skills to ensure you're at the top of your game.
We make sure that you have access to staff members that are best suited to help you. We work together to resolve issues and create memorable moments that empower you to enhance your reporting skills.
We are here to listen to you. We understand that using new technology can be frustrating, so we can answer questions or jump on a quick zoom call. Our entire staff has an in-depth knowledge of Reach Reporting and can quickly direct you to best practices to improve your reporting.
We are here focused on providing solutions that save you time and increase your value. We continue to improve each day and look forward to visiting with you. Your communication with us is vital and appreciated.
Please feel free to chat with us by clicking the help chat bubble in the lower right-hand corner of this page.
Reach out to your Reach Reporting Rep and schedule a zoom meeting by clicking the meeting link in their email signature.
Or schedule to join our onboarding webinars
Reach Reporting is dedicated to helping provide a knowledge base that is easy to understand and informative. If you still have questions that have not been answered, please let us know by emailing support@reachreporting.com, chatting with our support team, or calling us at (877) 467-7637. We are here to ensure that you have a positive experience with Reach Reporting, as we want to continue to be the reporting solution you trust.
Need more access to Reach Reporting Resources?
Reach Reporting has a wealth of knowledge and a robust online community to support you as you create reports that provide powerful insight. Please look into the following resources.
Reach Reporting Blog: We add blogs to our site every month to give you great information in a fun and friendly manner.
Case Studies: We interview one company per month to help our clients highlight how they are using Reach Reporting and how it is improving their services and firm offerings. These case studies are invaluable to our community.
Knowledge Center: From simple to complicated, we provide step-by-step guidance to utilize every aspect of Reach Reporting in our robust knowledge center.
Video Tutorials: We know watching is sometimes easier than reading, which is why all of our tutorials are video-based in the video tutorial section of Reach Reporting and Youtube.
Social Networks: Join us on FaceBook, LinkedIn, Youtube, and Twitter.
Competitor Comparisons: We have looked at all the reporting solutions on the market. We provide you with an in-depth look at Reach Reporting compared to some of the strongest competitors out there on our competitor comparison page.
Monthly Newsletter: Go to the footer of reachreporting.com and sign up to receive the Reach Reporting newsletters delivered directly to your inbox. Our newsletters cover tips and tricks, current events in accounting, strategies to improve your advisory services, and much more.
We look forward to helping you build insightful reports,
The Reach Reporting Team.