June 16, 2026
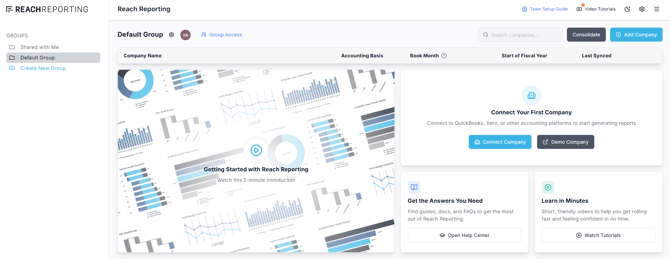
NEW INTEGRATION : Connect Digits to Reach Reporting

March 24, 2026
A Fresh Look, Same Powerful Reporting
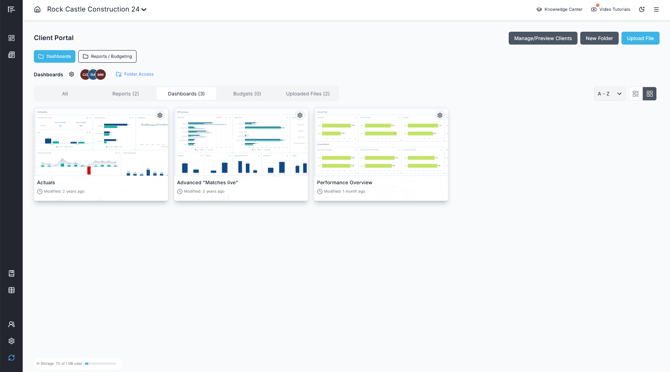
A More Seamless Client Experience
Updates to the client portal make it easier for your clients to access what they need—helping you deliver a more polished, professional experience.
Nov 11, 2025
Turn Dashboards Into Shareable PDFs

Filter Everything at Once

O
ct 14, 2025
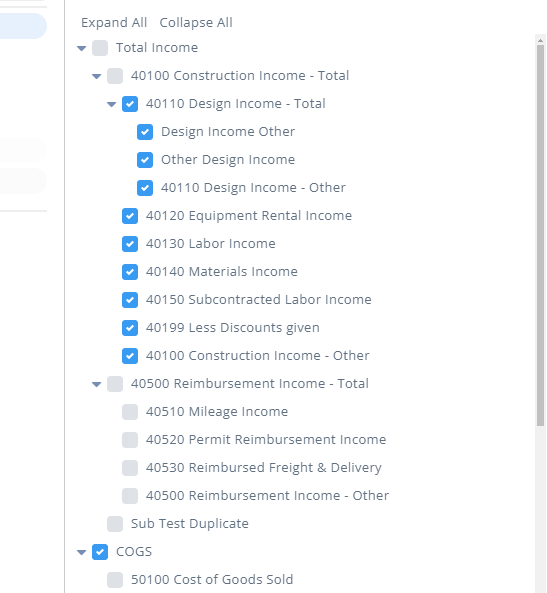
Customize Your Chart of Accounts Like Never Before
Sept 9, 2025
Budget Smarter Stay Synced
• New reset option instantly realigns your financial statements
• Warning icons flag unmapped or missing accounts
• Manual values and row logic stay intact, no rework required
Aug 19, 2025
NOW LIVE - Our 3rd AI Report Style

July 8, 2025
Export to Excel (Charts Included)

June 12, 2025
XERO: Hide Inactive or Archived Accounts

Workspace Owner Control: Template Management

Workspace Owners can now toggle shared templates at the workspace level to "User Only" status, giving them greater control over template visibility and access.
May 13, 2025
New  AI Report Style Now Available

You can now choose between two AI-generated report styles. More flexibility—same smart automation.
Take a look at a PDF of our Comprehensive Financial Report!
Use Your Already Built Data Sheets in Budgets Pro

Budgets Pro now supports data from Reach, Excel, and Google Sheets. Use your existing sheets to build budgets.
Build Metrics Faster

You can now create columns separated by Classes/Departments with a single click, when building new metrics or adding columns to existing metrics. Faster insights, no extra setup.
April 8, 2025
Actuals vs Budget with AI Reports and Dashboards

Discover our latest update: a cutting-edge AI feature that empowers you to effortlessly compare your actual data with your budget and automatically create Reports and Dashboards. With this innovation, you can seamlessly monitor your financial progress, make informed decisions, and let AI do the work to let you know what metrics to focus in on.

Our AI-generated reports and dashboards provide a clear view of where your numbers stand, helping you spot trends and stay on top of your financial goals. Experience a more efficient way to manage your budget and actuals today!
March 11, 2025
NEW AI-Powered Reports & Dashboards
We’re taking financial reporting to the next level! Our latest AI-powered feature automatically analyzes your data, identifying key trends, variances, and relationships—just like a seasoned financial analyst. With a single click, generate customized reports and stunning dashboards, tailored to your business needs in seconds.
No more manual work—just instant, actionable insights!
Feb 17, 2025
Check out the NEW section in your template library.

Easily find the latest report and dashboard templates in a dedicated section, keeping you up to date with newly added designs.
Google Sheets Nightly Sync
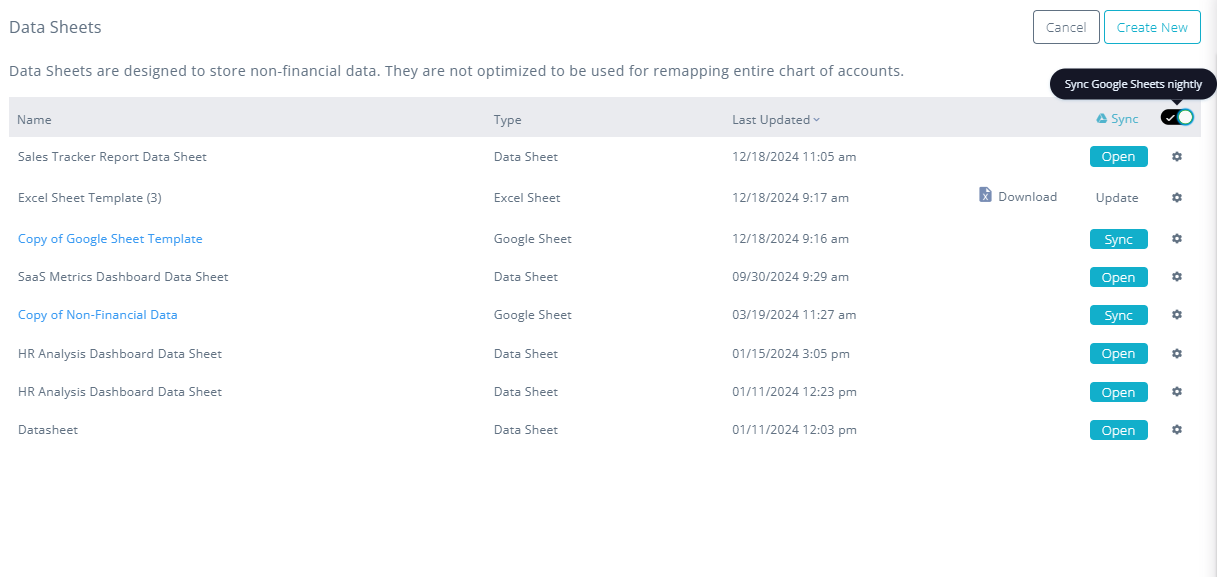
Ensure your reports always have the latest data with automatic nightly syncing from Google Sheets.
Linear Trend Forecasting in Budgets Pro
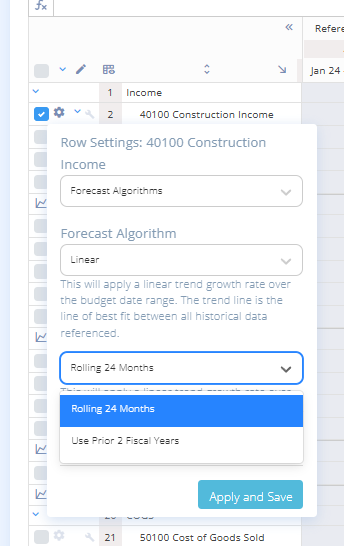
Get more accurate forecasts with the new linear trend option, which recalculates values based on the past 24 months of actuals prior to the forecast month when selected.
Jan 21, 2025
NEW MYOB Now Connects with Reach Reporting
New Feature: MFA with Authentication Apps!

At Reach Reporting, we’re always striving to provide the best security and ensure your data stays safe. That’s why we now support multi-factor authentication (MFA) via authentication apps! Apps like Google Authenticator and Authy offer stronger protection than text-based MFA by generating secure codes on your device, reducing the risk of phishing and SIM-swapping attacks.
Enable it today and enjoy the next level of security with Reach Reporting!
Dec 3, 2024
NEW FP&A Upgrade! Class/Dept Planning in Budgets Pro
Nov 19, 2024
Excel Data Sheets
We’ve added the ability to upload Excel sheets directly into the data sheets section, making it easier than ever to import non-financial data or other information from your bookkeeping software. You can now seamlessly showcase this data in your metrics or live text.
Data Sheet Insights in Dashboard Live Text
You can now use data from your added data sheets directly within the live text on your dashboard. This allows you to showcase non-financial or external data seamlessly integrated into your display.
Oct 15, 2024
Reference Column in Budgets Pro

The reference column boosts your budgeting by enabling quick, side-by-side comparisons with the previous year's data.
Retained Earnings Override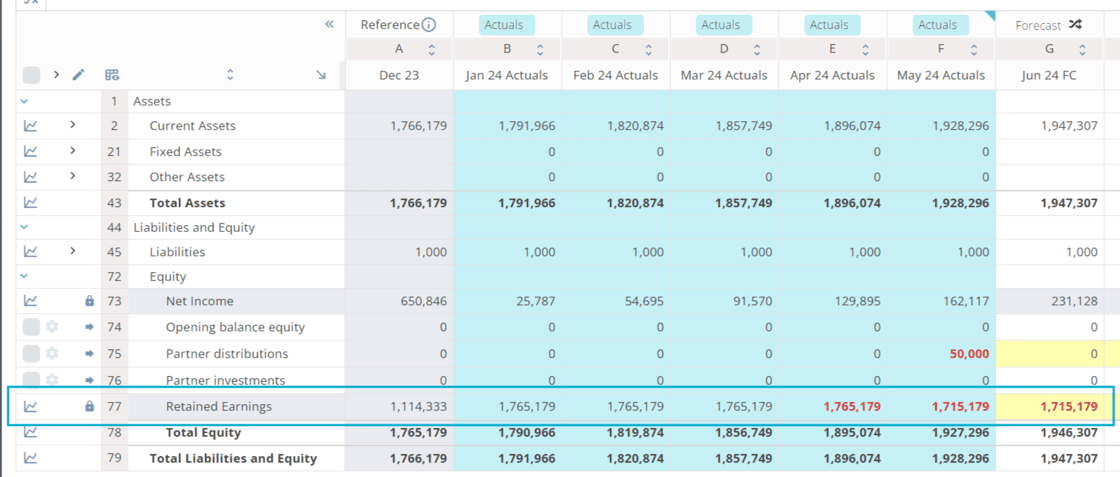
This feature is essential for users needing flexibility in financial reporting. In cases like restructuring, mergers, dividends, or major financial changes. Simply override your retained earnings by typing over or use equations in your budget or forecast.
New Number of Months
You can now add number of months as a data point from the data picker, this will return a count of the months for columns this data point is added to.
Sept 10, 2024
EBIT / EBITDA
Introducing the new EBITDA feature! Easily set up and track this key financial metric to focus on core operating performance. Simply configure relevant accounts in your settings and view insights through updated dashboards and KPI scorecards. Start optimizing your business analysis today!
Secondary Admin Permissions
Secondary admin permissions can now be granted by the workspace owner by clicking the gear next to the users name and selecting "Make Secondary Admin".
A secondary admin can do everything the workspace owner can except manage billing or remove the workspace owner.
July 19, 2024
July New Updates
We are excited to introduce a new feature in the "My Templates" section for reports, dashboards, and metrics/statements. With the new "Hide" option, you can now easily clean up your template libraries. This feature allows you to streamline your workspace by hiding templates that are not currently in use, making it simpler to focus on the templates that matter most.
By utilizing the "Hide" option, you can maintain a clutter-free and organized template library, ensuring that your most frequently used templates are always at your fingertips. This improvement is designed to enhance your productivity and improve your overall user experience.
Try out the new "Hide" option today and take control of your template management with ease!
June 11, 2024
✨AI Enhanced Reporting ✨
Tell a story about your data in one click. Simply analyze any metric or statement and provide actionable insights.
-
Create a month-end summary.
-
Detect trends and make better-informed financial decisions.
-
Provide data-driven recommendations.
-
Save hours of your time.
Managing Chart of Accounts in Budgets PRO
Learn how to update Budgets PRO when your Chart of Accounts changes.
Bank & Credit Card Mapping for Xero
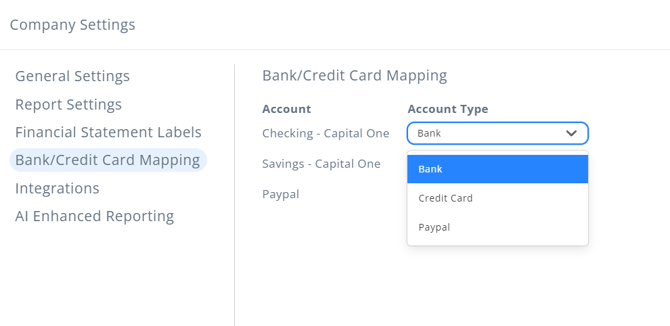
You can now map your bank and credit cards for Xero companies.
May 14, 2024
Email Notifications to Client Portal Users
Enhance your client experience with our new alert client function. Effortlessly notify individual clients or broadcast updates to your entire client base directly from the client portal.
Reset Demo Company
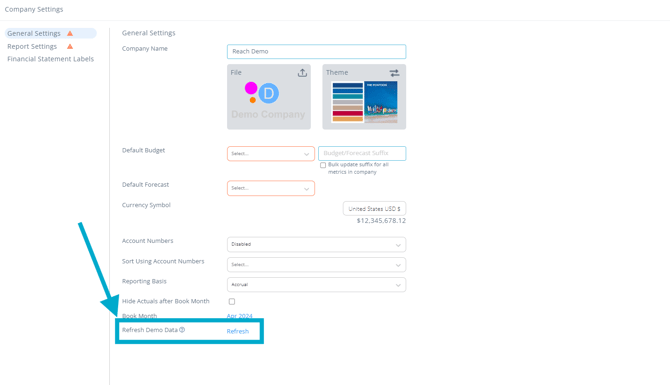
Easily refresh the data within your demo company directly from your company settings. The demo company is best used to test and showcase what is possible. This can be accessed in the upper right menu.
Keyboard Shortcuts in Metric/Statement Builder
Checkout some of our newly added keyboard shortcuts that can be used inside the metric and statement builder HERE.
April 9, 2024
Hide Zero Value Rows in Budgets PRO
Our new Hide Zero Value Rows feature in Budgets PRO simplifies your financial planning. Now, with just a click, you can hide all zero value rows, making your budget clearer and easier to analyze.
Bold Icon Easy Access
![]()
This enhancement allows users to quickly bold values or text within the metric and report builder, simplifying the process of highlighting essential data.
Mar 19, 2024
Google Sheets in Budgets PRO
Now, with the enhanced capabilities of Google Sheets, you can seamlessly integrate an even broader array of data into your budgeting processes. By effortlessly linking your data from Google Sheets, you can efficiently incorporate it into your budget, facilitating more comprehensive financial analysis and decision-making.
New Align Options

The report builder now offers new horizontal and vertical distribution options in its align settings, allowing users to easily arrange elements with precision. These features streamline design, saving time and effort while improving the overall appearance and readability of reports.
Multi-Select in Data Picker
The latest update to the data picker feature brings a handy improvement: the shift-click functionality. Now, users can quickly select a range of accounts by holding down the shift key while clicking. This enhancement simplifies the process of data selection, saving time and improving overall workflow efficiency within the data picker interface.
Right Click to Insert Columns
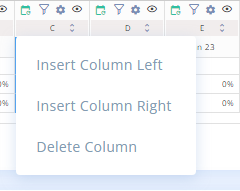
Users can now insert new columns effortlessly by right-clicking on column headings, akin to the existing functionality for rows. This update simplifies data organization and enhances user efficiency within spreadsheets.
Show Zeroes in Bar Charts

The latest update introduces the ability to display 0 values on Bar charts, providing users with more comprehensive data visualization options.
Feb 13, 2024
Client Portal List View

Simplify organization and unlock a world of convenience with our client portal featuring tailored access with folders and now a list view option for easier viewing
Copy and Paste Cell Formatting

Improve the metric and statement building experience with our intuitive copy-and-paste cell formatting feature. Simply copy and right-click or use the shortcut Ctrl+Alt+V.
Jan 16, 2024
Linked Data Sheet Templates
Our latest update revolutionizes data management by integrating a connected data sheet with any dashboard or report. Create and save any template with a connected data sheet, which can be effortlessly transferred and applied across different companies, streamlining the report building process. Save hours, enhance your reporting capabilities and explore new supplementary reports and dashboards in our template library.
Become a Reach Reporting Pro!

A Preferred Partner is a master of the Reach Reporting tool, giving their clients an expert to turn to for all things financial reporting and planning. Earn your Reach Reporting Preferred Partner Badge when you visit the video tutorials section and watch all 9 "Learn the Basics" videos.